
Rankings view: V-Score + Edge + tags drive the player pool.


Understand the system in under 45 seconds: rank conviction, find salary value, and choose a profile that matches your contest strategy.
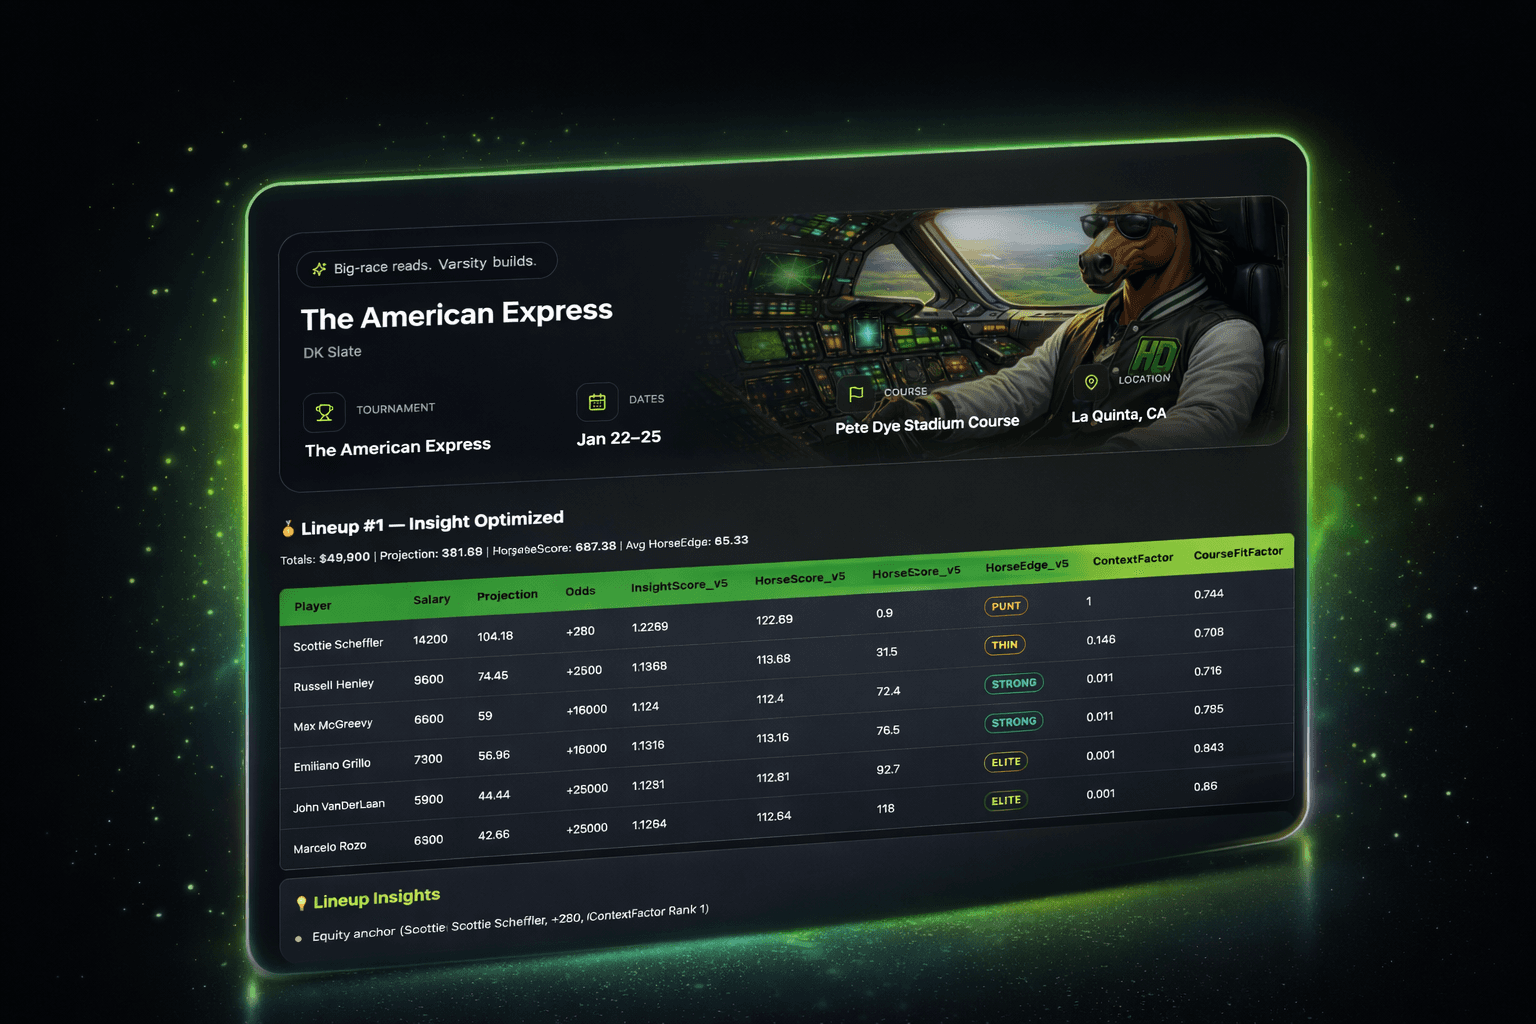
These are real report surfaces used to make lineup decisions before lock.

Next: choose which optimization profile to trust for this slate.
After reviewing Rankings and Lineups, use these profiles to choose the right build strategy.
Use these three signals together for faster, cleaner decisions.
What: Model conviction score for player quality independent of raw projection rank.
How to use: Start your pool with top V-Score players, then pressure-test with Edge and risk tags.
What: Salary-relative value signal using expected salary curves, not just absolute output.
How to use: Prioritize UNDERPRICED and VALUE players that still fit your contest risk target.
What: Context labels for lineup construction (e.g., SAFE/NEUTRAL/RISKY and role tiers).
How to use: Use tags to avoid fragile combinations and keep lineup structure intentional.
Simple pre-lock flow for consistency and speed.
Go to current reports and open the slate you are building.
Use V-Score, Edge, and risk tags to shape a tighter candidate pool.
Compare profile lineups to choose the strategy that matches your contest goal.
Pick one coherent build story and avoid random last-minute swaps.
Maverick is a dedicated slate chat experience that complements Copilot when you want to stay inside one report.
Use Maverick to ask slate-specific questions, compare player decisions in context, and continue a focused chat from the report you already have open.
Copilot is still the broader workflow assistant. Maverick keeps the conversation anchored to the current slate so the next question starts from the same report context.
Find a slate, open the report, then use Maverick for follow-up questions while you work through rankings, profiles, and lineup choices.
Find a ReportQuick definitions for the terms you see in report views.
V-Score is Varsity Data's conviction score for player quality. It helps rank players beyond raw projection lists.
Edge measures salary-relative value. A player can have a strong projection but still be FAIR or PRICEY at a given salary.
Profiles intentionally change lineup construction priorities (projection, balance, value, form, or course-history emphasis).
No. Start with Varsity as default, then compare one alternate profile that matches your contest style.