

See how it works
Product in practice
Explore the ways Varsity Data supports your research: compare players, understand a slate, and return to the evidence after the event. These walkthroughs show the product in use.
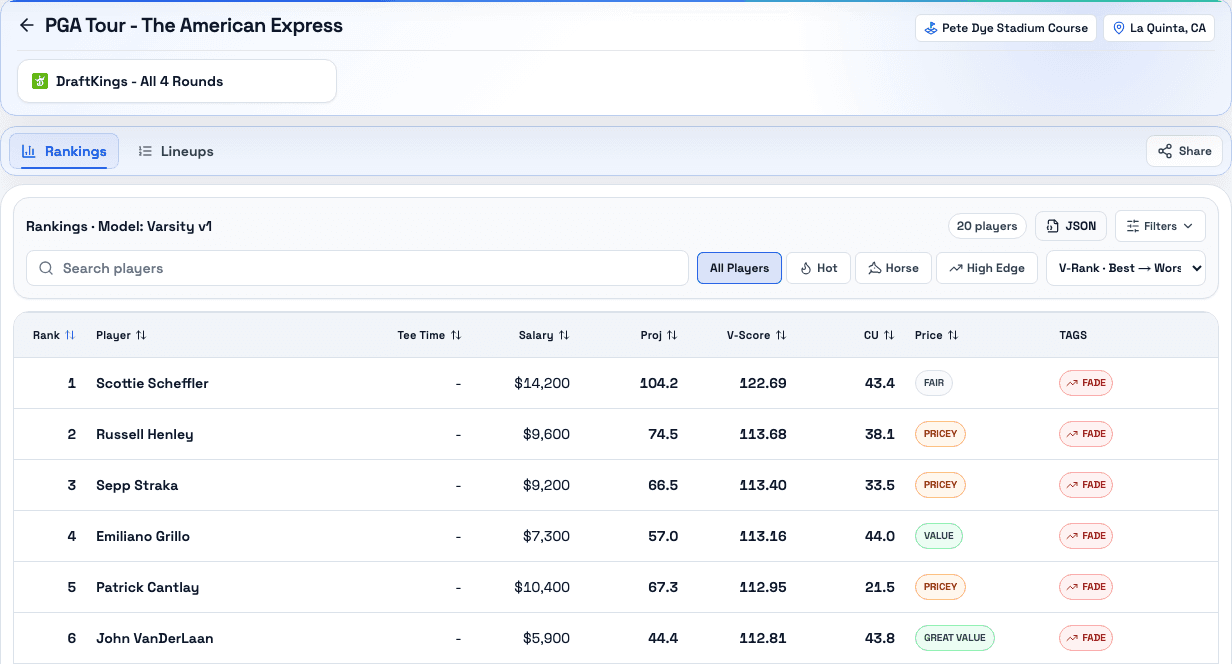
Golf · Compare players
Put rankings and salary in the same view.
Open a Golf report to compare player rankings with the available salary and scoring context. Use that first pass to identify the players you want to research further.
Football · Understand the slate
Start with the event you are researching.
Choose a published NFL report and check its event, date, and contest context. Compare the available rankings before you move into lineup research.
A report research walkthrough
Find the report
Choose Football in the report browser and check the event date.
Compare the rankings
Look at the players and the context available for that slate.
Investigate your selections
Use available lineup information and your own research to evaluate the fit.
NFL report access may require sign-in and an active account. Lineups require the appropriate account access.
After the event · Inspect the evidence
Make review part of the routine.
Where results have been published, return to the report to inspect what happened. For the Golf model's historical evaluation, use the backtesting page and read the methodology alongside the results.
See what is inside your next report.
Explore the report browser, or follow the Quick Start for a guided first look.